The operating system for automated clinical laboratories.
Labtronic unifies instrument monitoring, CMMS, work orders, scheduling, workflow management, and asset tracking — in one audit-ready platform purpose-built for high-throughput labs.
Your instruments are automated. Everything around them isn't.
Clinical labs invest millions in automated platforms, but the coordination layer — scheduling, maintenance, asset tracking, compliance — still lives in spreadsheets, emails, and manual processes.
Fragmented visibility
Instrument status lives in Slack threads, whiteboards, and LIMS notes. Nobody has a single view of what's running, what's down for maintenance, and what's available for the next batch.
Disconnected maintenance & operations
Work orders, preventive maintenance, and asset records live in separate systems from scheduling and execution. Operators can't see upcoming maintenance when planning runs — and service teams can't see run schedules when planning repairs.
Compliance without traceability
Regulatory audits demand a complete record of every action, instrument state change, and operator decision. Without a unified system, generating those records means days of stitching data from five different tools.
From LIMS order to completed run — one connected system
Labtronic ties together the entire operational lifecycle: workflow setup, scheduling, bench execution, maintenance, and compliance. No handoff gaps, no missing records.
Design Workflows
Map your protocols as multi-step workflows with branching paths that match how your lab actually operates.
Schedule & Queue
Batches flow in from LIMS and get scheduled around operator shifts, instrument availability, and method run times.
Instrument Console
Operators work from a tablet at each instrument — starting runs, completing checks, and logging events right at the bench.
Manage & Maintain
Full CMMS with work orders, PM schedules, and asset tracking. Service teams and operators share the same system.
Audit Everything
Every action, status change, and operator decision is automatically logged with a timestamp and attribution.
Total lab orchestration — not just another scheduling tool
Most labs stitch together 5+ disconnected tools for maintenance, asset tracking, scheduling, monitoring, and compliance. Labtronic replaces all of them.
Operate
Real-time control from the bench to the control room.
Instrument Console
Tablet-mounted interface at each instrument for runs, status checks, and event logging.
Live Monitoring
See what's running, idle, or down — across every lab, updated in real time.
Status Forms
Configurable check templates for readiness, handoffs, and maintenance verification.
Orchestrate
From LIMS intake to scheduled run — workflows, queues, and capacity in one place.
LIMS Integration
Batches flow in directly from your LIMS — no re-keying, no copy-paste errors.
Workflow Designer
Map multi-step protocols with branching paths so batches follow the right process every time.
Scheduling & Queue
Gantt and calendar views that respect operator shifts, method run times, and instrument availability.
Maintain
Full CMMS, asset management, and compliance — built in.
Work Orders
Preventive & corrective maintenance with comments, file attachments, and approval workflows.
Asset Management
Instrument inventory with lifecycle tracking, lab assignments, and bulk import.
Analytics & Audit
Runs, errors, and usage hours per instrument. Complete audit trail for every action taken.
Built for the people running the lab
Supervisors and service engineers need answers fast: what's running, what's stuck, what's overdue, what to defend in the next audit. Labtronic puts every one of those answers on a screen — connected to the same live data.
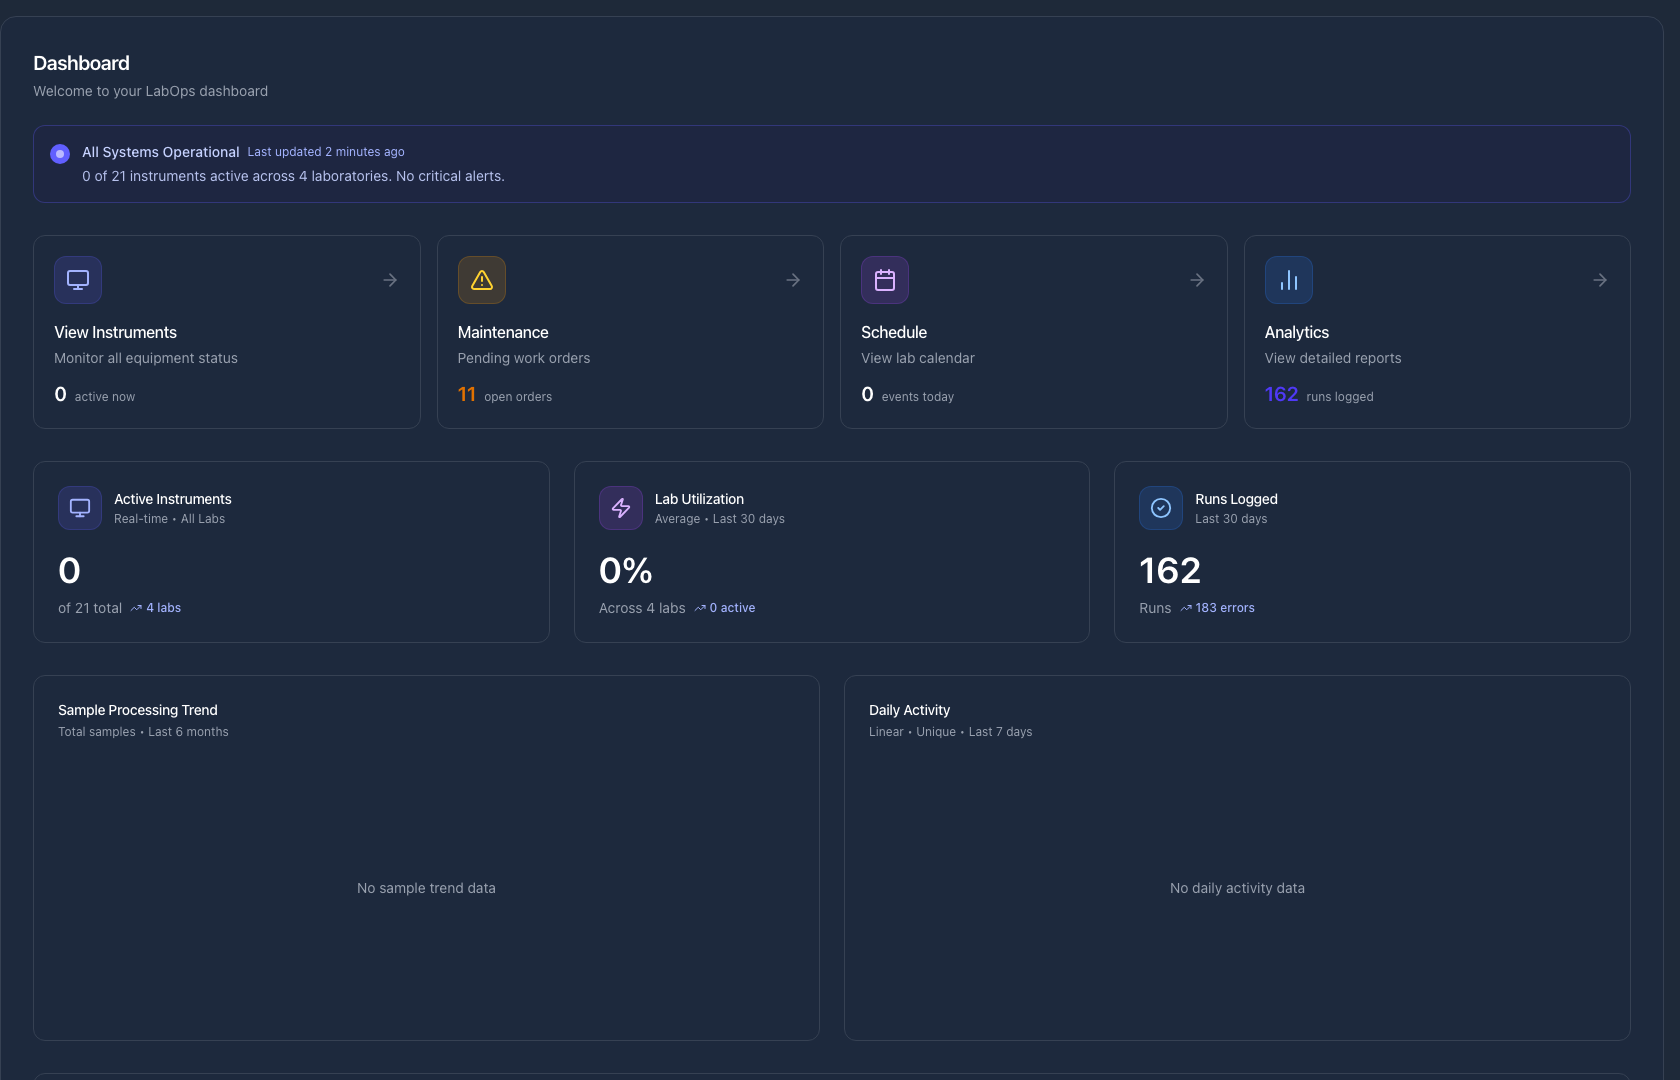
Start your shift on one screen
The dashboard surfaces open work orders, today's schedule, and live instrument health across every lab — so supervisors know exactly where the day stands before the first batch loads.
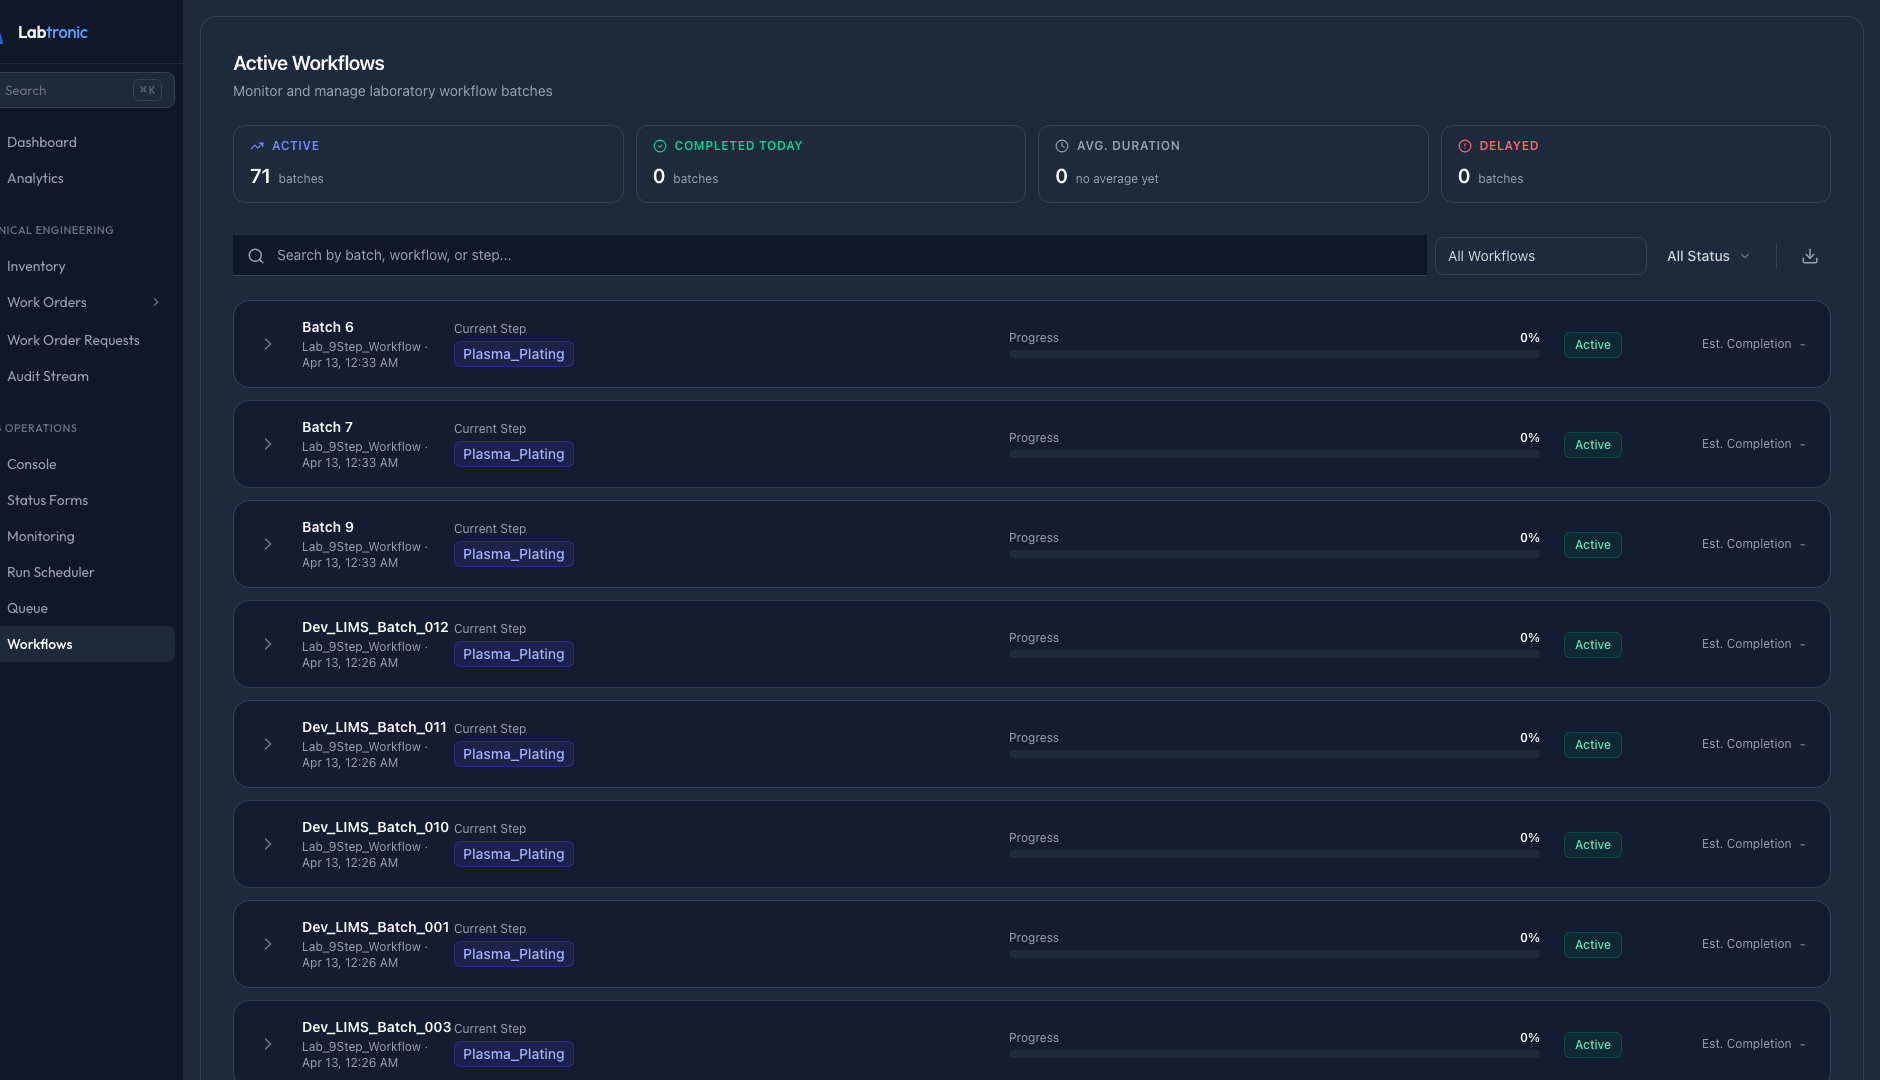
Track every active batch in flight
Active workflows show the current step, progress, and status of every batch in the lab. Spot delays as they happen instead of finding out at end-of-shift handover.
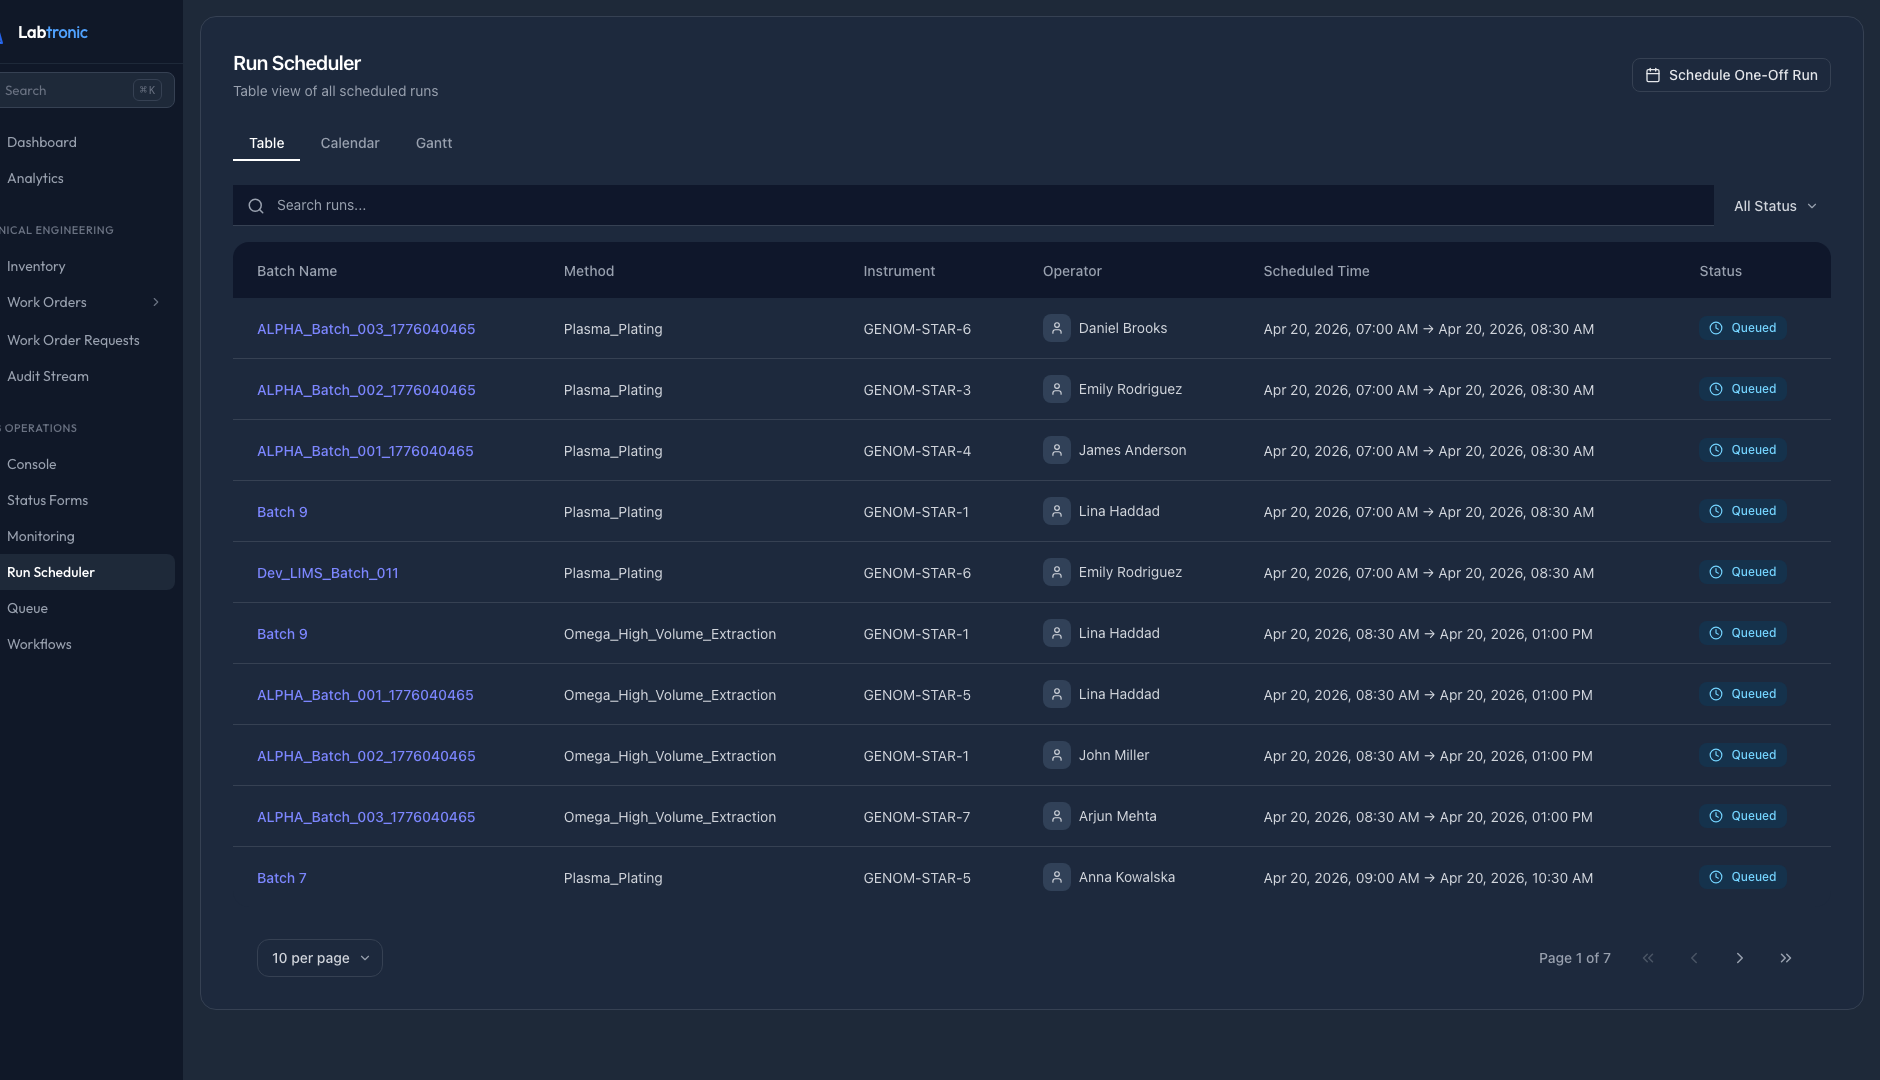
Schedule against real capacity
Plan runs around the operators on shift and the instruments actually online. The scheduler flags conflicts before they become missed deadlines on the floor.
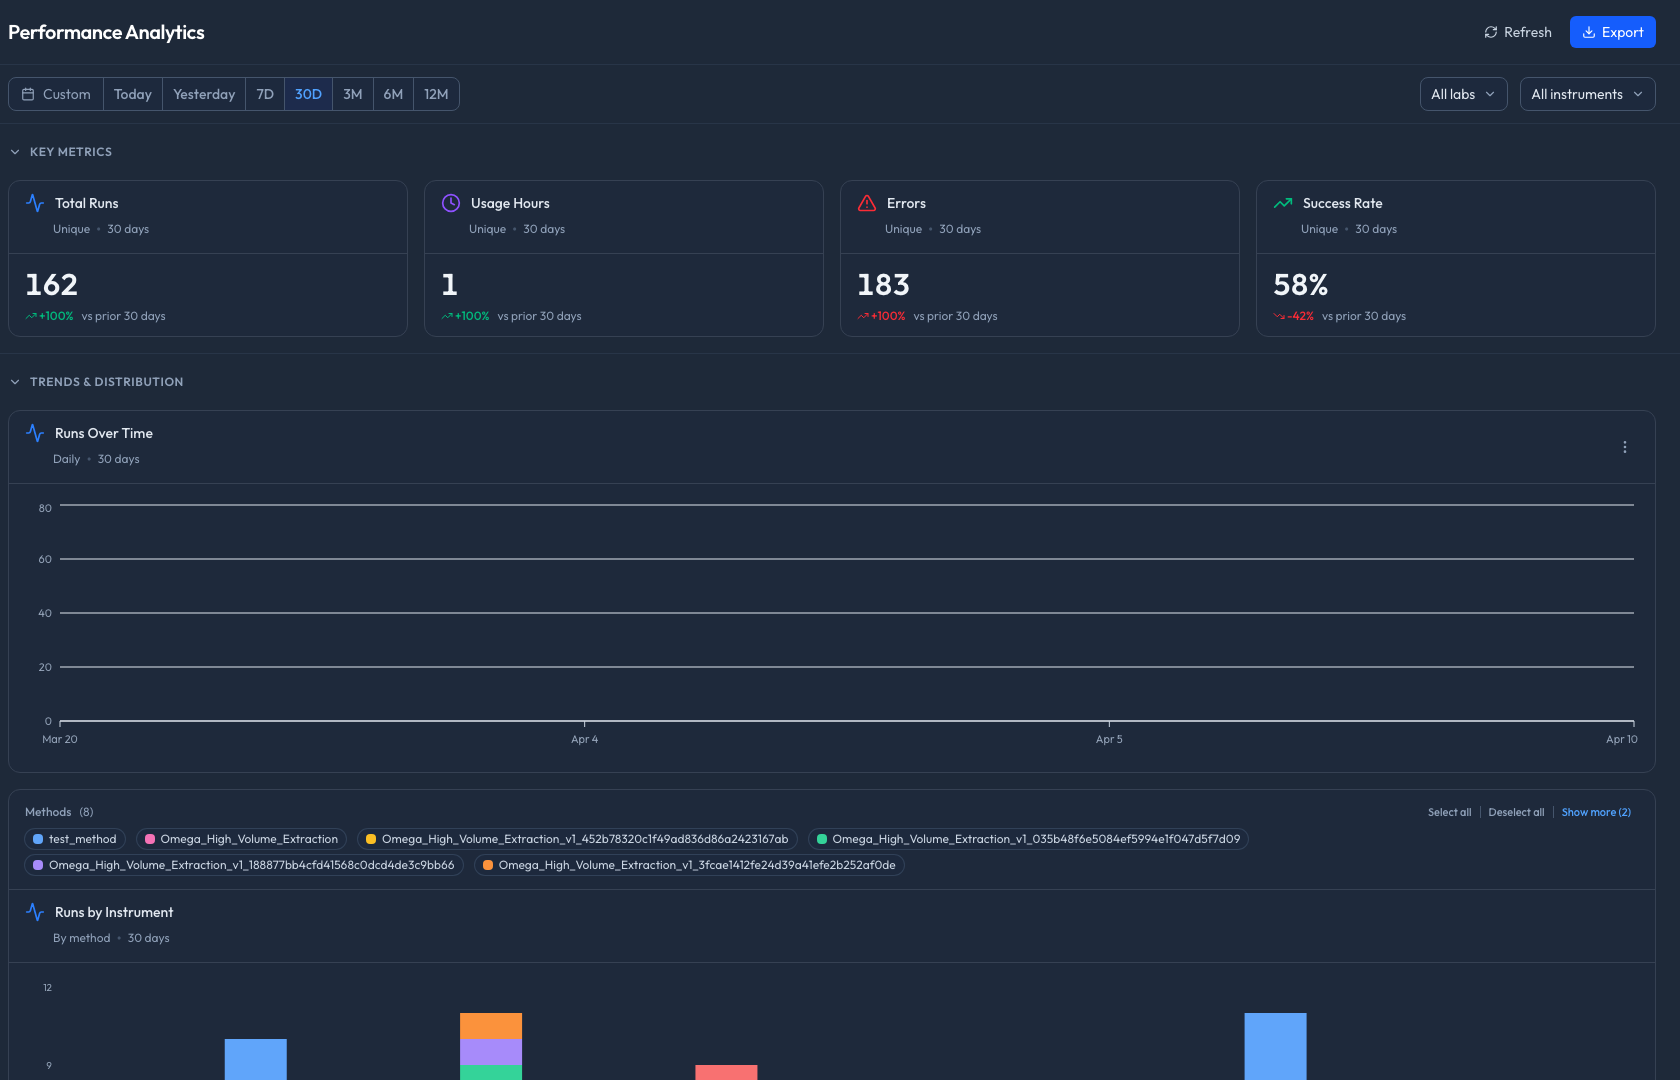
Defend uptime with hard numbers
Total runs, usage hours, errors, and success rate per instrument or lab — the exact data engineering and QC need for service reviews, KPI reports, and audits.
Ask your lab anything
Labtronic AI is a built-in operations assistant that answers questions about runs, systems, work orders, and scheduling — pulling from live data across every connected instrument and workflow.
Live operational status
Ask which instruments are running, down, or idle. Get system counts by lab, downtime durations, and the reasons behind each outage.
Scheduling & coverage
Find which operators are free at a given time, who has no runs scheduled, and which instruments are unbooked — without opening the scheduler.
Work orders & maintenance
Surface overdue, high-priority, and open work orders. See what needs attention right now without digging through filters.
Audit trail queries
Ask who took an instrument offline, who created a work order, or what changed — with full attribution and timestamps.
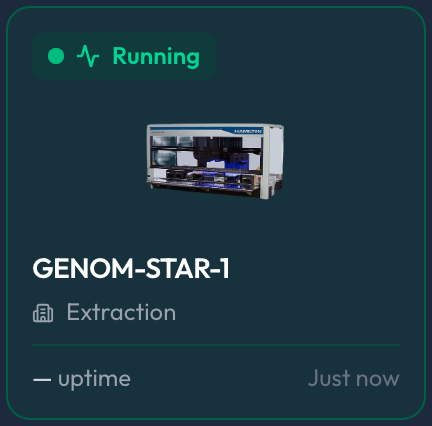
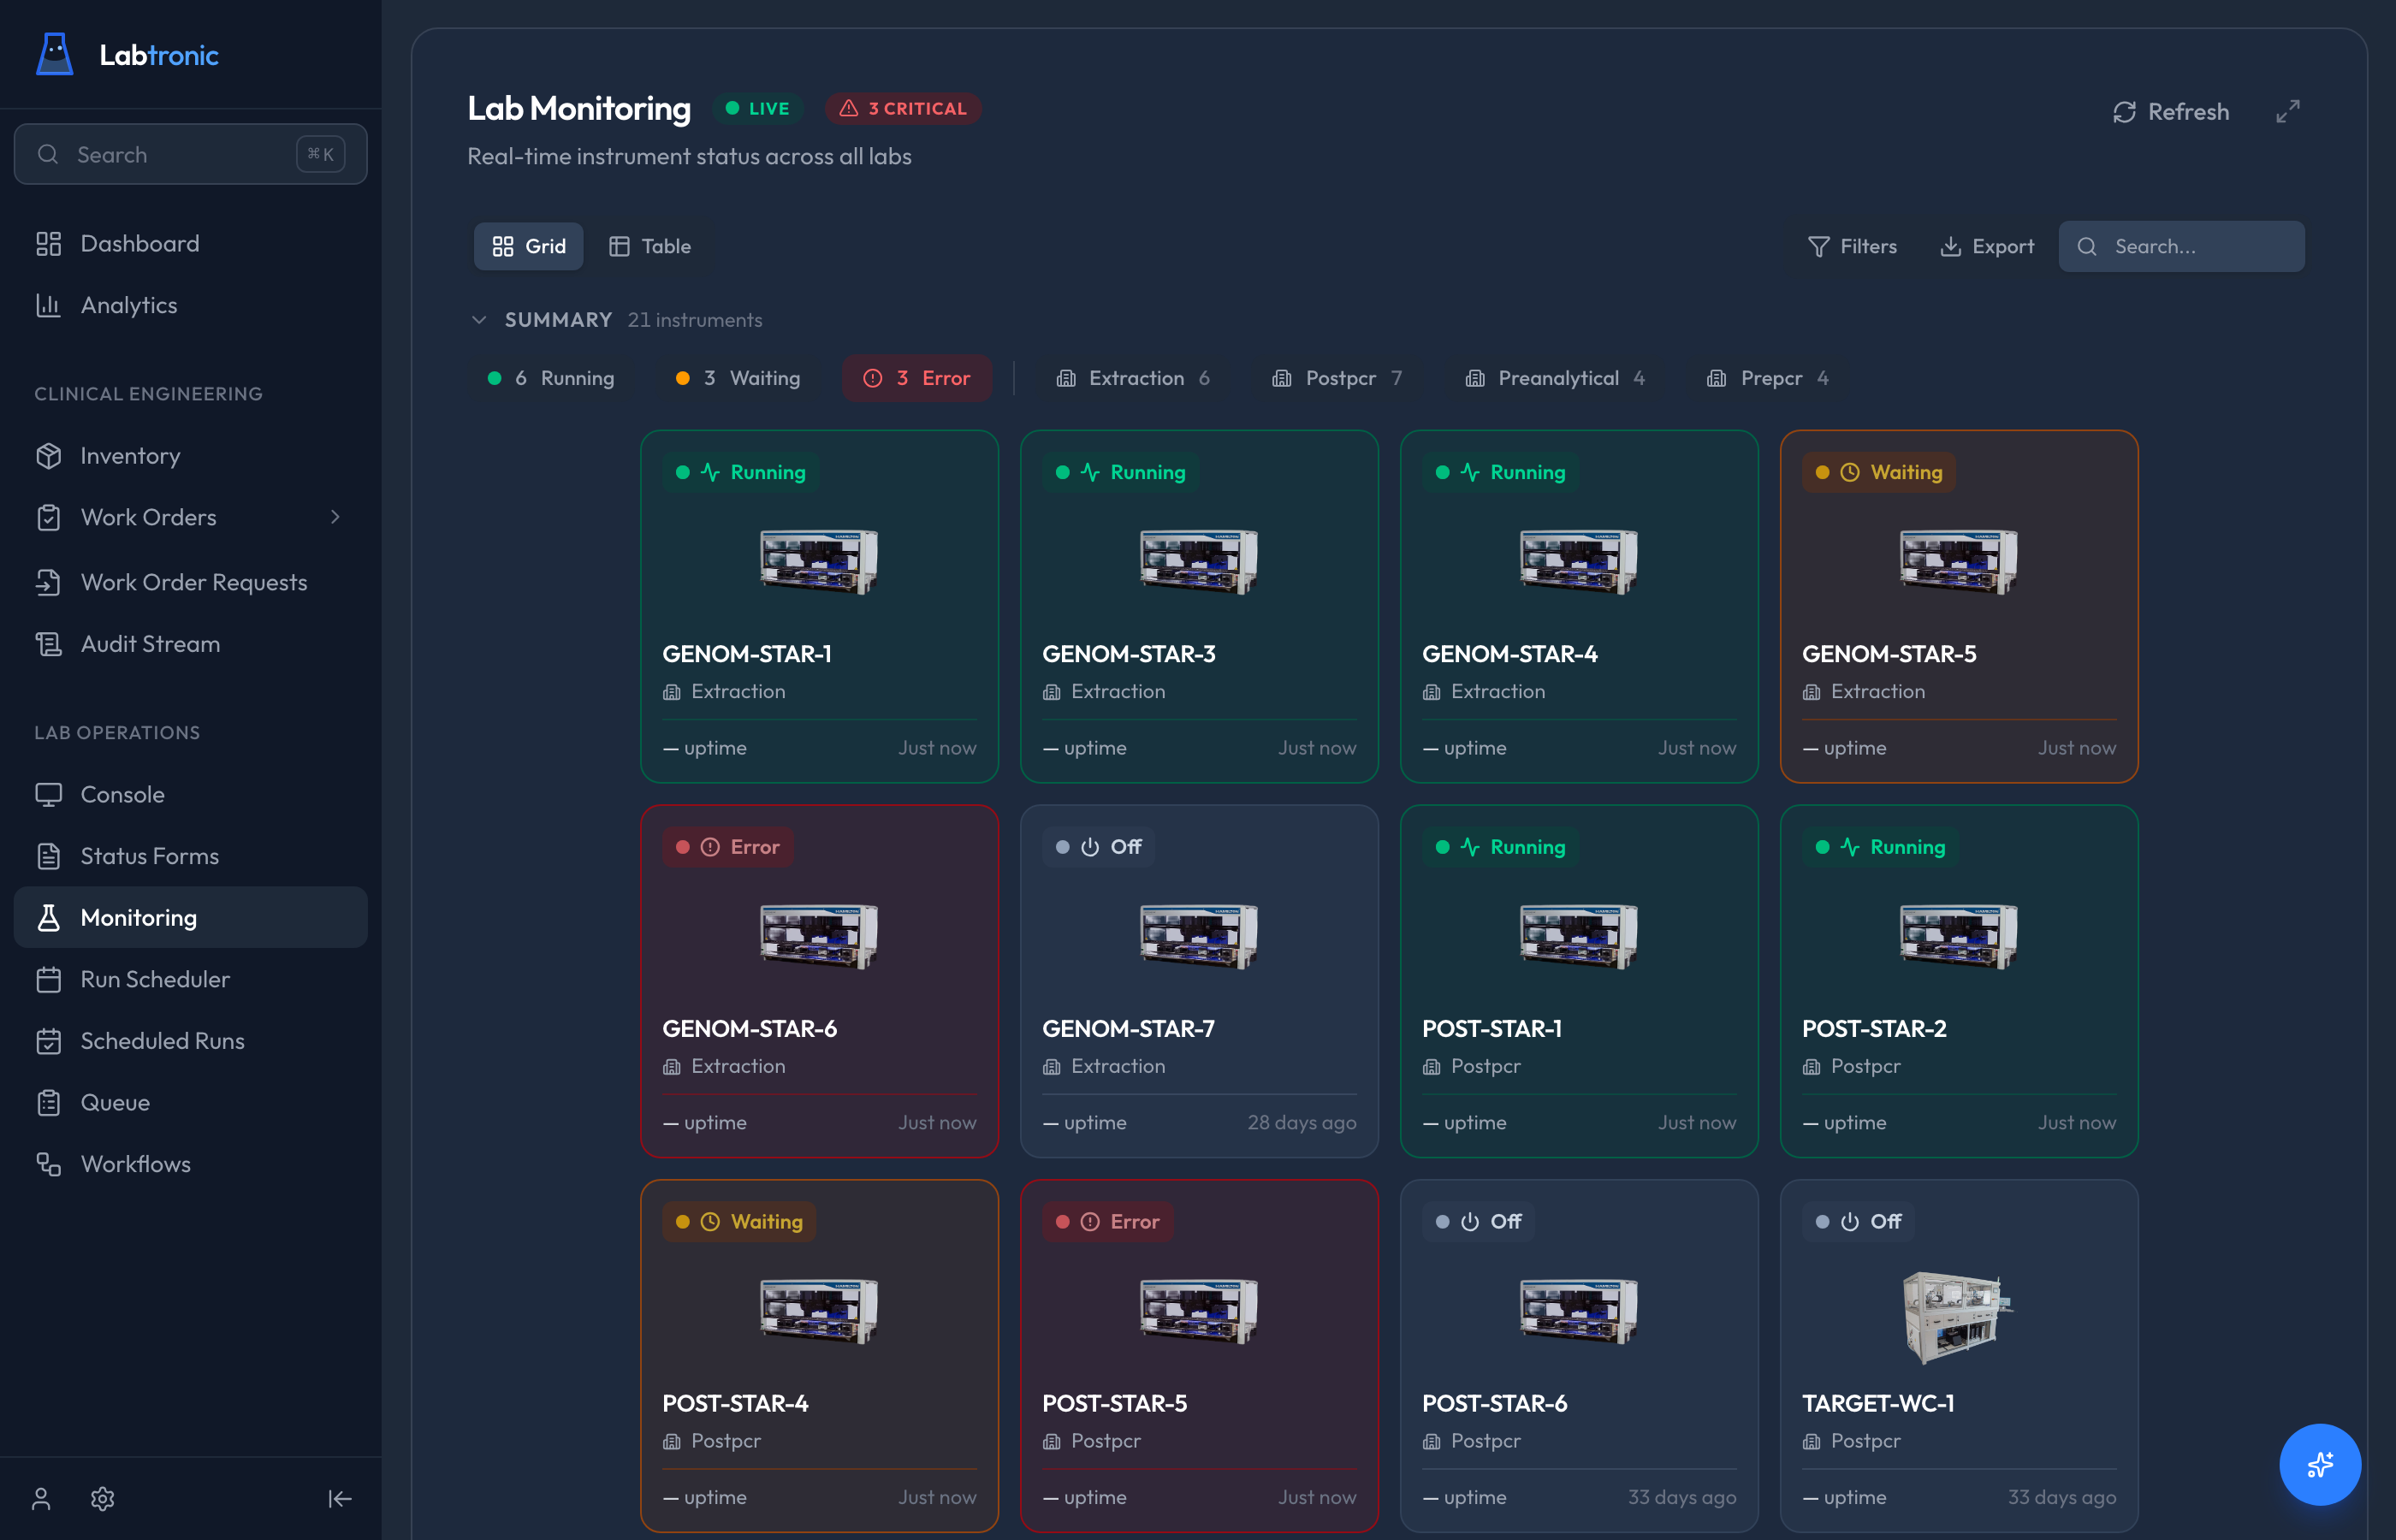
Every instrument, one screen
The monitoring dashboard gives you a live, at-a-glance view of every connected instrument across all labs — colour-coded by status so nothing slips through the cracks.
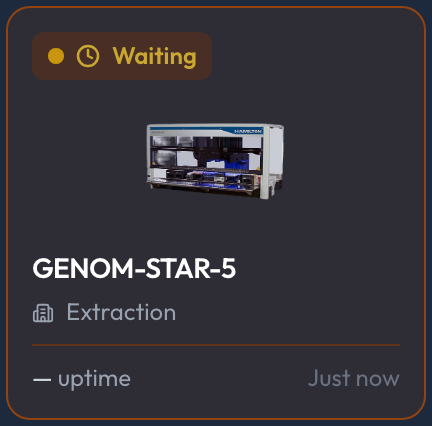
Live status feeds
Running, waiting, error, and offline — each instrument reports its state in real time. Status changes propagate instantly, no polling or page refreshes.
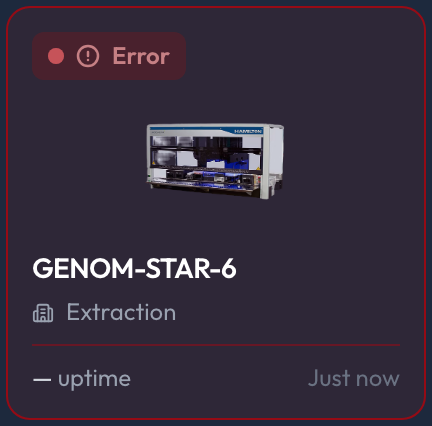
Critical alerts at a glance
Error counts surface in a persistent banner so you spot failures the moment they happen — before they cascade into downstream delays.
Filter by type or lab
Slice the grid by instrument category — extraction, post-PCR, pre-analytical, or prep — to focus on the group that matters right now.
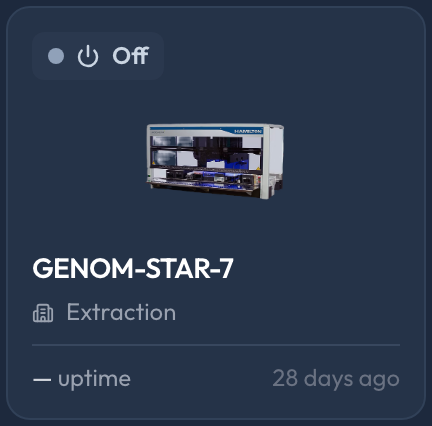
Uptime & history
Each card shows its last-seen timestamp and uptime duration, giving you a rolling picture of reliability without digging into logs.
Ready to run your lab from one system?
Labtronic is in early access. If your lab is tired of juggling separate tools for maintenance, scheduling, monitoring, and compliance — let's talk.
Thanks! We'll be in touch.
We'll reach out within a couple of business days to learn more about your lab.